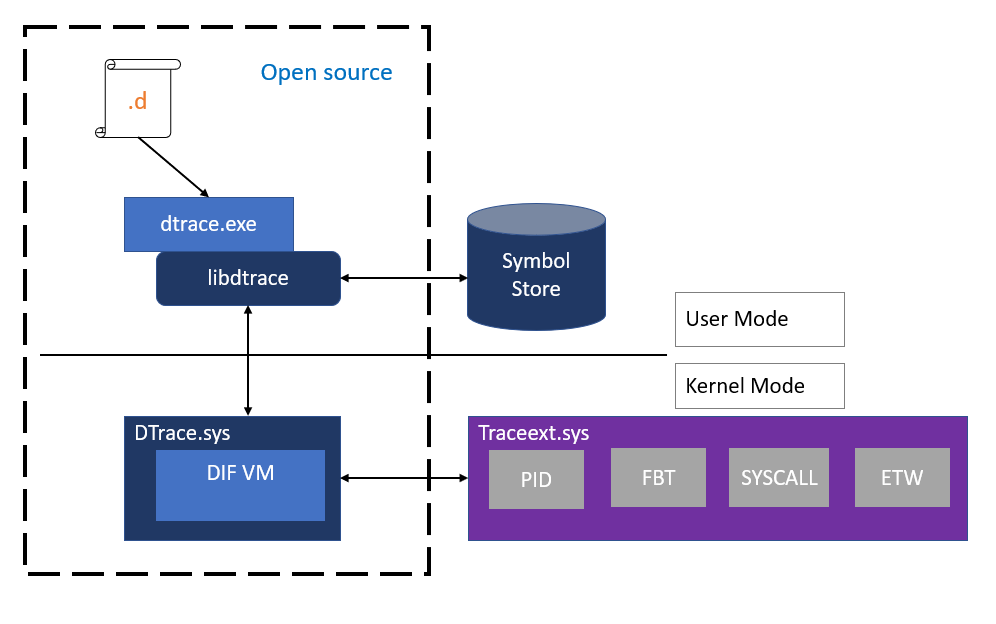
 Microsoft ported the analysis tool DTrace to Windows and released it for general use last week. Here is some information about this tool, where to obtain it and what to know else.
What is DTrace?
DTrace (Dynamic Tracing) is a system tool for real-time kernel and application analysis. It was originally developed by Sun Microsystems for Solaris. DTrace's goal is to optimize applications and the operating system itself and troubleshoot errors. Thus it is a programming tool for debugging, but it does not work with breakpoints like a classic debugger.
Port for Windows
DTrace is now available as a port on several Unix-like systems. Now Microsoft has ported DTrace for Windows and announced its availability in this Techcommunity article. DTrace requires the Windows 10 Insider Build 18342 or higher and is only available for 64-bit systems. In addition, only 64-bit processes can be analyzed. The article explains how to set up the tool.
(Source: Microsoft)
The tool is available as an MSI installer in the Download Center free of charge. Microsoft makes its implementation available on GitHub.
In my opinion, the tool should only be of interest to developers, especially since it is operated via console commands. Users and administrators don't need any traces of the system or the processes. The Windows Debugger is needed to analyze crash files (dumps). And processes can be analyzed using tools such as the Process Monitor from the Sysinternals Tools. The Windows Performance Analyzer from the Windows Assessment and Deployment Kit (Windows ADK) or as an app from the Store is still available.


